Understanding the difference between Oscilloscope and Spectrum Analyzer
Before diving into the use of a Spectrum Analyzer (SA), a short explanation between an Oscilloscope and a SA might be handy. If you used a SA before, this article might not be to any interest to you, since this article covers a basic understanding.
For those who a curious to what a SA is, hang around, since this article is about to demonstrate the difference between a Oscilloscope ans a SA.
When starting with electronics, sooner or later you might find yourself wanting an Oscilloscope to look at (fast) changing electronic signals. In other words: An scope is a multi functional tool in a electronics lab, and every good electronics labs should have one. With a scope it’s possible to look at electronic signal, being it digital signal or analogue signal which changes over time. But a scope can also be used to measure voltages, and all other characteristics of a signal. For example, the fall and rise time of edges, period of a signal, the max and min voltages, and perform math functions on signals.
Using a Oscilloscope to look at a signal
Most often a scope is used to look at a signal, and see how it looks like. For example a sinus signal: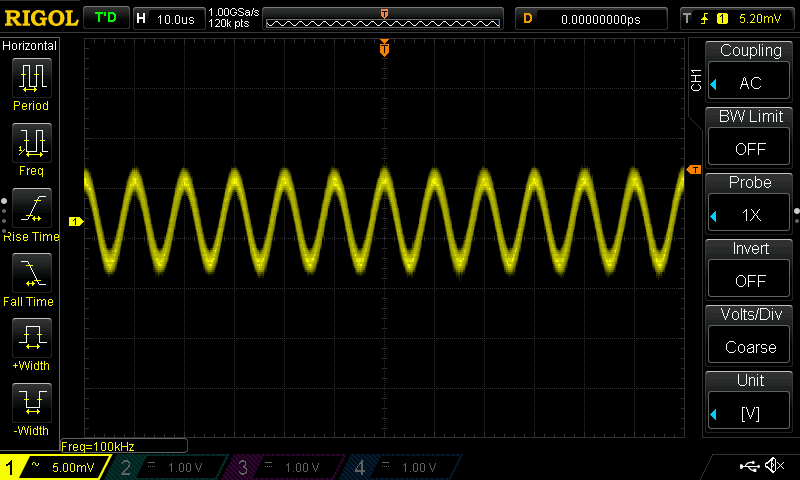
Looking at the signal we can tell that the signal is 50mV (Peek to Peek), and that the frequency of the signal is 100Khz. Looking at the signal closer, it’s not a sharp clean sinus signal. So what’s wrong ?
If we zoom into the signal to have a closer look, the signal looks like: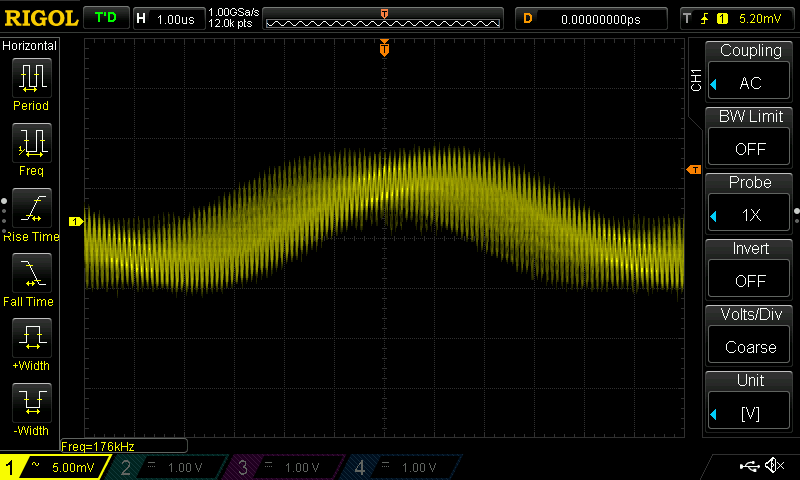
This is doesn’t look like a clean signal. At this point several things may be the cause:
-
-
- Is there something which interferes with the signal?
- Is the measurement done properly (aka signal integrity)
-
This is the point, where it’s very difficult, to use a scope to investigate this further. Just let’s assume that this is no measurement fault. Short ground leads are used, and the probes are calibrated.
That leaves us with a interfering signal of some kind.
-
-
- How to determine what kind of signal this is?
- What is the frequency of this interfering signal ?
-
At this point some want’s to use a feature which is called “FFT” which some scope might have. FFT stands for: Fast Fourier Transform spectrum analyser When using this feature the scope is behaving like a SA.
Having a FFT feature on a scope might be handy, in my case the FFT feature on my Rigol Ds1054Z is not very helpful: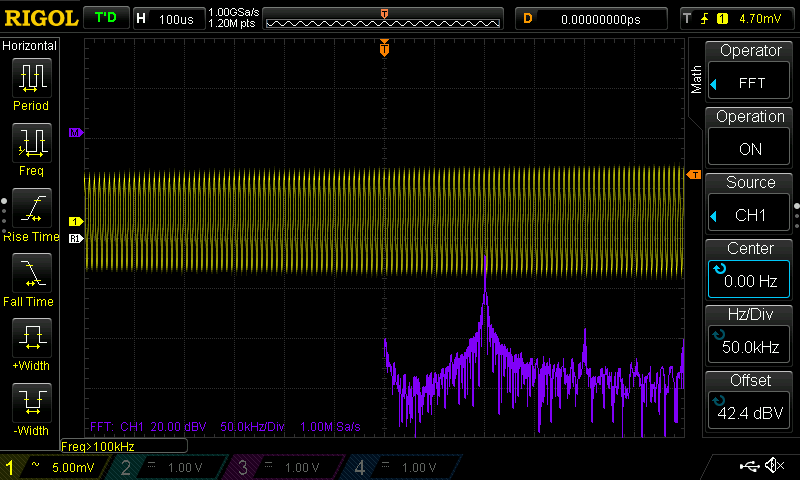
It shows that there seems to be an extra signal, but it’s not possible to get any detail on this signal. To get more detail, a real Spectrum Analyzer is needed.
What is a Spectrum Analyzer (SA)
A Spectrum Analyzer might at first glance be some kind of a scope. It has a display to show signals, and has a lot of buttons, like a scope.
However the main difference between a scope and SA is that:
-
-
- A scope shows signals in the time domain
- A SA shows signals in the frequency domain
-
This means that a SA show on the horizontal the frequency, and on the vertical the power of the signal, which is shown in a Logarithmic scale. This can be for example in dB or dBm. The reason for displaying the power (on a scope you would say the amplitude) of the signal in a Logarithmic scale is that low power signal can be displayed next to high power signals.
And since a SA displays signals in the frequency domain, it’s possible to see how “pure” or “clean” a signal is, since we can actually look at the “spectrum” of the signal. Hence why it’s called a “Spectrum Analyzer”.
Using a Spectrum Analyzer to look at a signal
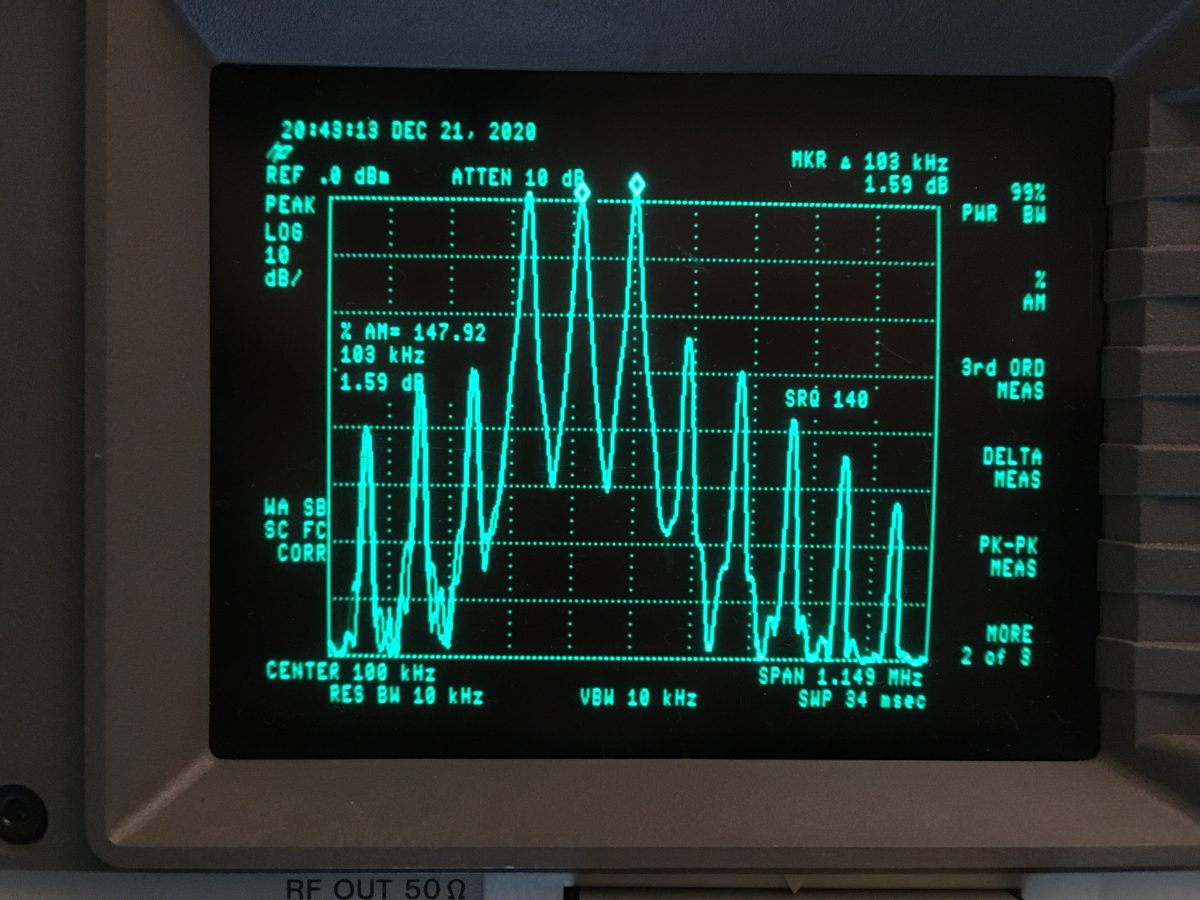
Let us look at the same signal which we looked at on the scope, but now feed into a Spectrum Analyzer:
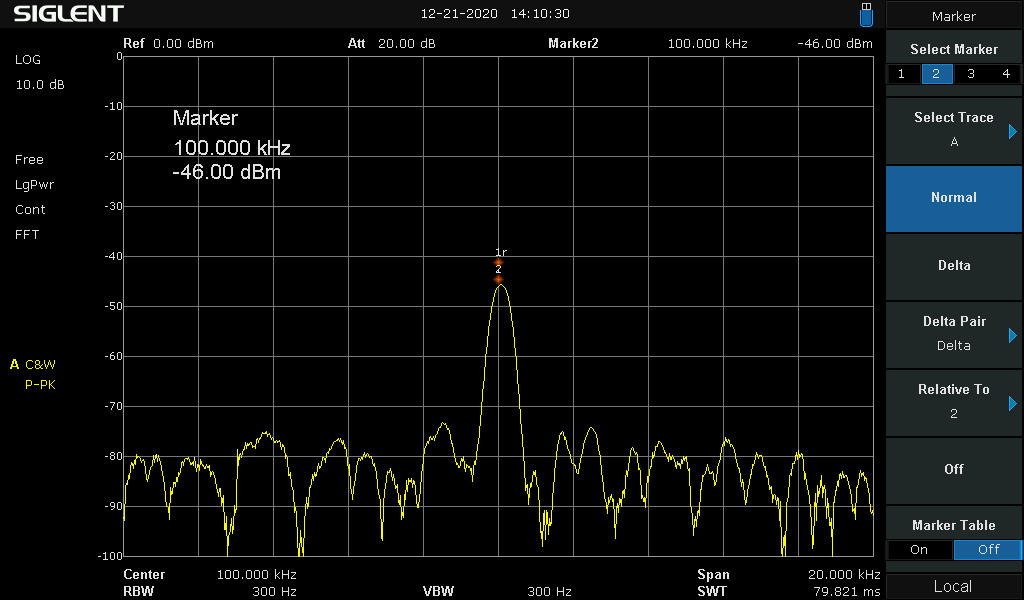
Here is the same signal, but it looks quite different from the signal which is shown on the scope. However it’s frequency is 100Khz, and the power of the signal is -46.00 dBbm. Which is about 3.169 mVpp (There is some loss in the cables, and adapters used).
Looking at the signal it’s seems “not clean”, But it’s hard to see. So like on a scope, it’s possible to zoom into the signal, and get more detail. To this we need to set a smaller SPAN. The SPAN on a SA is the bandwidth were we are looking at it. It’s like the zoom-lens on a camera, by zooming in, more details are visible. Currently the SPAN width is 20.000Khz.
If we change the SPAN width to let’s say 1.000Khz, we see the following:
And suddenly a second signal appeared. To get more details about this signal, the SA provides a easy way, and that’s by placing a marker. In this case a delta marker is used. A delta marker can show the difference (delta) between signals.
And then we see that the interfering signal is a 100Hz away from our original signal of 1oo.ooo Khz signal. So the interfering signal is 100.1 Khz.
Conclusion
And this shows the difference between a scope and a SA. An SA is a very handy tool when looking at the spectrum of a signal. It’s how every a more complex, and sometimes more confusing tool to use. On the other hand, a scope is also a complex tool to use. But in general, a scope is much more used for looking at signal then a SA. A SA is mostly used when dealing with RF, radio’s transmitters and alike.